
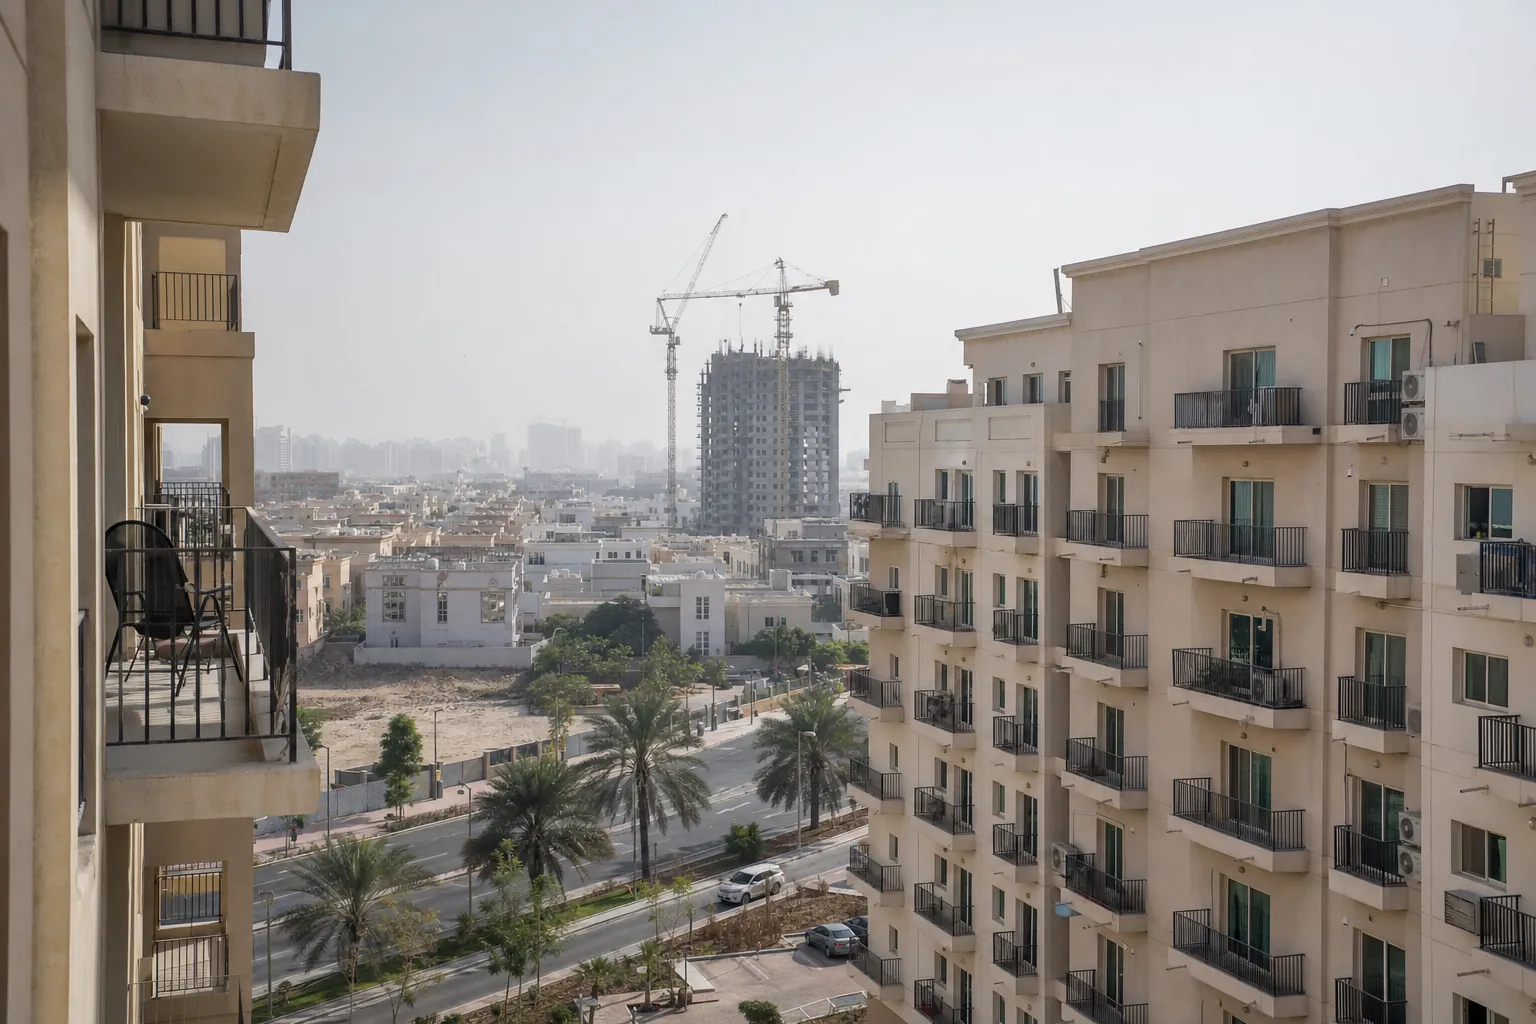
Dubai Property Prices and Market Report: September 2026
Dubai recorded 10,373 residential property sales worth AED 23.63 billion in September 2026, according to Property Monitor. Off-plan units accounted for 7,188 of them, or 69.3%, and the average price paid across every residential sale was AED 2,278,054. Prices held close to their highs: Property Monitor's Dubai-wide median stood at AED 1,632 per square foot in August 2026, 3.0% below its peak of AED 1,683, and twice the level of August 2020.
This edition sets out September's prices, rents and gross yields community by community, closes the third quarter, and adds the Dubai price index back to 2008 so the month can be read against eighteen years of data rather than one. Every figure is Property Monitor data read on 5 October 2026 unless stated otherwise.
| Measure | September 2026 |
|---|---|
| Total residential sales | 10,373 |
| Off-plan sales (Oqood) | 7,188 (69.3%) |
| Ready and resale sales (Title Deed) | 3,185 (30.7%) |
| Total value of sales | AED 23.63 bn |
| Off-plan share of value | 60.6% |
| Average price paid | AED 2,278,054 |
| Change vs August 2026 (volume) | -7.03% |
| Change vs August 2026 (value) | -1.16% |
| Dubai price index, latest (August 2026) | AED 1,632 per sq ft |
| Price index vs its peak (October 2025) | -3.0% |
Source: Property Monitor, September 2026 Dubai Real Estate Market Statistics and Dubai City Index.
Are Dubai property prices falling?
Only slightly. Property Monitor's Dubai City Index, the median sale price per square foot across the emirate, reached AED 1,683 in October 2025, touched the same level again in March 2026, and has eased each month since to AED 1,632 in August 2026. That is 3.0% below the peak. The index has not yet been updated for September.
| Month | AED per sq ft | Against the peak |
|---|---|---|
| Oct 2025 | 1,683 | 0.0% |
| Nov 2025 | 1,676 | -0.4% |
| Dec 2025 | 1,673 | -0.6% |
| Jan 2026 | 1,667 | -1.0% |
| Feb 2026 | 1,673 | -0.6% |
| Mar 2026 | 1,683 | 0.0% |
| Apr 2026 | 1,670 | -0.8% |
| May 2026 | 1,658 | -1.5% |
| Jun 2026 | 1,639 | -2.6% |
| Jul 2026 | 1,636 | -2.8% |
| Aug 2026 | 1,632 | -3.0% |
Community readings point the same way. Of the 64 apartment communities with a September price reading, 42 were lower than in August, 14 were higher and the rest unchanged, with a median change of -0.51%. Among villas and townhouses 26 communities eased and 12 rose, with a median change of -0.36%. Small moves of this size are well inside the range a median can drift on the mix of units sold in a single month.
Sales activity has come down further than prices. September's 10,373 sales fall between the September totals of 2022 and 2023, and most Dubai homes are bought with cash or modest loans, so owners are rarely forced to sell into a slower month. That combination is why lower volume has so far moved prices by a few percent.
Dubai property price history, 2008 to 2026
Reading the index for September of each year shows where today's prices sit in the longer cycle. Prices first peaked at AED 1,211 per square foot in September 2008, fell to AED 853 by September 2012, set a new high of AED 1,234 in September 2014, then declined for six years to a low of AED 807 in August 2020. The rise since then has run for five years.
| Reading | AED per sq ft | Change on previous September | High of the year (month) |
|---|---|---|---|
| September 2008 | 1,211 | 1,211 (Sep) | |
| September 2009 | 870 | -28.2% | 893 (Nov) |
| September 2010 | 860 | -1.1% | 914 (Jun) |
| September 2011 | 874 | +1.6% | 925 (Feb) |
| September 2012 | 853 | -2.4% | 901 (Dec) |
| September 2013 | 1,021 | +19.7% | 1,096 (Dec) |
| September 2014 | 1,234 | +20.9% | 1,234 (Sep) |
| September 2015 | 1,155 | -6.4% | 1,214 (Jan) |
| September 2016 | 1,115 | -3.5% | 1,162 (Jan) |
| September 2017 | 1,089 | -2.3% | 1,107 (Jun) |
| September 2018 | 1,037 | -4.8% | 1,090 (Jan) |
| September 2019 | 915 | -11.8% | 1,000 (Jan) |
| September 2020 | 823 | -10.1% | 872 (Jan) |
| September 2021 | 968 | +17.6% | 977 (Oct) |
| September 2022 | 1,047 | +8.2% | 1,089 (Dec) |
| September 2023 | 1,243 | +18.7% | 1,281 (Dec) |
| September 2024 | 1,448 | +16.5% | 1,493 (Dec) |
| September 2025 | 1,681 | +16.1% | 1,683 (Oct) |
| August 2026 (latest) | 1,632 | 1,683 (Mar) |
At AED 1,632 the index is 102% above the August 2020 low, 32% above the 2014 high and 35% above the 2008 peak. The 2014 high was not passed again until 2023, which is the clearest guide in the data to how long a flat stretch in Dubai can last. The table is a record of past prices and says nothing certain about the next year.
How did Dubai's property market perform in Q3 2026?
Dubai registered 34,646 residential sales worth AED 73.88 billion in the third quarter of 2026, from July to September. Volume was 2.2% lower than the second quarter's 35,420, and off-plan made up 71.0% of the quarter's sales. The quarter was 3.2% larger than Q3 2023 and more than three times Q3 2019.
| Quarter | Residential sales | Against Q3 2019 |
|---|---|---|
| Q3 2017 | 9,321 | 1.0x |
| Q3 2018 | 6,060 | 0.7x |
| Q3 2019 | 9,174 | 1.0x |
| Q3 2020 | 7,429 | 0.8x |
| Q3 2021 | 14,357 | 1.6x |
| Q3 2022 | 23,219 | 2.5x |
| Q3 2023 | 33,587 | 3.7x |
| Q3 2024 | 47,487 | 5.2x |
| Q3 2025 | 56,089 | 6.1x |
| Q3 2026 | 34,646 | 3.8x |
For the year to date, January to September 2026 recorded 114,583 sales, against 89,708 in the same nine months of 2023 and 122,746 in 2024. At the nine-month pace a full year would come to about 153,000 sales, a total only 2024 and 2025 have exceeded.
How many properties were sold in Dubai in September 2026?
Dubai registered 10,373 residential sales in September 2026: 6,423 off-plan apartments, 2,445 ready apartments, 765 off-plan villas and townhouses, and 740 ready villas and townhouses. Ready sales were almost unchanged from August (3,189); the -7.0% monthly dip came from off-plan, which follows the timing of project launches.
| Month | Off-plan | Ready | Total sales | Value (AED bn) |
|---|---|---|---|---|
| Jan 2026 | 10,630 | 5,365 | 15,995 | 53.50 |
| Feb 2026 | 10,080 | 5,538 | 15,618 | 45.79 |
| Mar 2026 | 9,311 | 3,593 | 12,904 | 37.33 |
| Apr 2026 | 10,011 | 3,117 | 13,128 | 38.37 |
| May 2026 | 7,196 | 2,338 | 9,534 | 21.85 |
| Jun 2026 | 9,553 | 3,205 | 12,758 | 25.59 |
| Jul 2026 | 9,431 | 3,685 | 13,116 | 26.34 |
| Aug 2026 | 7,968 | 3,189 | 11,157 | 23.91 |
| Sep 2026 | 7,188 | 3,185 | 10,373 | 23.63 |
| Month | Residential sales | Against September 2019 |
|---|---|---|
| September 2017 | 2,626 | 0.8x |
| September 2018 | 2,169 | 0.6x |
| September 2019 | 3,391 | 1.0x |
| September 2020 | 3,250 | 1.0x |
| September 2021 | 5,135 | 1.5x |
| September 2022 | 7,997 | 2.4x |
| September 2023 | 12,214 | 3.6x |
| September 2024 | 17,220 | 5.1x |
| September 2025 | 19,260 | 5.7x |
| September 2026 | 10,373 | 3.1x |
Apartment prices in Dubai by community, September 2026
Apartment prices ranged from AED 658 per square foot in International City to AED 9,415 on Jumeirah Bay Island. Half of the 58 communities Property Monitor tracks sat above AED 1,420 per square foot, between Zabeel (AED 1,434) and Jumeirah Lakes Towers (AED 1,404). Popular mid-market choices cluster lower: Jumeirah Village Circle at AED 1,259 per square foot with a median price of AED 1,192,671, Arjan at AED 1,375, and Dubai Silicon Oasis at AED 959.
Gross yield in the table is the per-square-foot rent over the per-square-foot price in the same row, so unit size does not distort the comparison.
| Community | AED/sq ft | Median price (AED) | Avg annual rent (AED) | Gross yield |
|---|---|---|---|---|
| Jumeirah Bay Island | 9,415 | 23,782,290 | 1,235,214 | 5.2% |
| Bluewaters Island | 5,060 | 9,613,202 | 498,902 | 5.2% |
| Dubai Harbour | 3,209 | 4,117,570 | 215,865 | 5.2% |
| Dubai Water Canal | 3,160 | 5,023,605 | 242,205 | 4.8% |
| Expo City | 2,884 | 3,163,748 | 97,633 | 3.1% |
| City Walk | 2,744 | 4,788,420 | 261,314 | 5.5% |
| The Hills | 2,584 | 4,038,792 | 196,672 | 4.9% |
| Madinat Jumeirah Living | 2,544 | 3,016,686 | 176,512 | 5.9% |
| Downtown Dubai | 2,497 | 2,669,792 | 142,556 | 5.3% |
| Palm Jumeirah | 2,448 | 5,120,170 | 268,466 | 5.2% |
| Dubai Creek Harbour | 2,274 | 2,708,834 | 150,268 | 5.5% |
| Dubai Hills Estate | 2,248 | 3,162,472 | 194,870 | 6.2% |
| DIFC | 2,066 | 2,995,454 | 184,629 | 6.2% |
| Al Jaddaf | 2,054 | 1,218,069 | 47,440 | 3.9% |
| Sobha Hartland | 1,987 | 1,877,403 | 116,074 | 6.2% |
| The Views | 1,959 | 2,432,768 | 142,619 | 5.9% |
| Al Barari | 1,954 | 11,809,693 | 823,148 | 7.0% |
| Dubai Marina | 1,883 | 2,428,851 | 138,030 | 5.7% |
| Al Habtoor City | 1,815 | 2,551,651 | 145,282 | 5.7% |
| Business Bay | 1,813 | 2,300,017 | 145,696 | 6.3% |
| Jumeirah Heights | 1,799 | 4,462,462 | 206,460 | 4.6% |
| Dubai Maritime City | 1,783 | 2,189,524 | 138,862 | 6.3% |
| Meydan | 1,711 | 6,218,294 | 324,573 | 5.2% |
| The Greens | 1,706 | 1,885,495 | 113,627 | 6.0% |
| Dubai Healthcare City 2 | 1,676 | 1,384,516 | 84,665 | 6.1% |
| Jumeirah Beach Residence | 1,550 | 2,479,600 | 152,528 | 6.2% |
| Jumeirah Golf Estates | 1,532 | 2,527,800 | 157,707 | 6.2% |
| Zabeel | 1,434 | 2,652,216 | 173,900 | 6.6% |
| Jumeirah Lakes Towers | 1,404 | 1,743,147 | 123,169 | 7.1% |
| Arjan | 1,375 | 911,740 | 59,343 | 6.5% |
| Wasl Gate | 1,374 | 1,021,105 | 74,545 | 7.3% |
| Barsha Heights | 1,327 | 1,459,700 | 90,662 | 6.2% |
| Dubai Science Park (DuBiotech) | 1,321 | 1,642,314 | 121,715 | 7.4% |
| DAMAC Hills | 1,318 | 1,638,175 | 119,850 | 7.3% |
| Town Square | 1,318 | 2,084,246 | 148,832 | 7.1% |
| Dubai Festival City | 1,311 | 3,172,136 | 230,916 | 7.3% |
| Al Furjan | 1,288 | 4,294,004 | 298,870 | 7.0% |
| Jumeirah Village Triangle | 1,272 | 1,207,925 | 85,662 | 7.1% |
| Jumeirah Village Circle | 1,259 | 1,192,671 | 86,177 | 7.2% |
| Al Barsha | 1,227 | 1,110,254 | 68,400 | 6.2% |
| Mirdif | 1,140 | 1,259,700 | 83,151 | 6.6% |
| Rukan | 1,117 | 725,147 | 61,116 | 8.4% |
| Dubai South Residential District | 1,105 | 829,795 | 58,578 | 7.1% |
| Dubai South | 1,103 | 1,117,258 | 79,855 | 7.1% |
| Living Legends | 1,078 | 1,880,674 | 138,152 | 7.3% |
| Dubai Studio City | 1,030 | 893,010 | 65,892 | 7.4% |
| DAMAC Hills 2 | 1,011 | 2,049,639 | 173,556 | 8.5% |
| Motor City | 1,010 | 1,363,730 | 100,130 | 7.3% |
| Dubai Production City | 986 | 686,256 | 58,694 | 8.6% |
| Al Khail Heights | 975 | 957,934 | 75,121 | 7.8% |
| Dubai Silicon Oasis | 959 | 815,006 | 61,056 | 7.5% |
| Dubai Sports City | 957 | 842,530 | 67,910 | 8.1% |
| Remraam | 937 | 993,977 | 79,310 | 8.0% |
| Discovery Gardens | 935 | 652,860 | 50,605 | 7.8% |
| Liwan | 867 | 798,913 | 60,926 | 7.6% |
| Dubai Residence Complex | 832 | 670,026 | 52,124 | 7.8% |
| Dubai Investments Park | 701 | 1,281,215 | 125,890 | 9.8% |
| International City | 658 | 419,146 | 37,373 | 8.9% |
Villa and townhouse prices in Dubai by community, September 2026
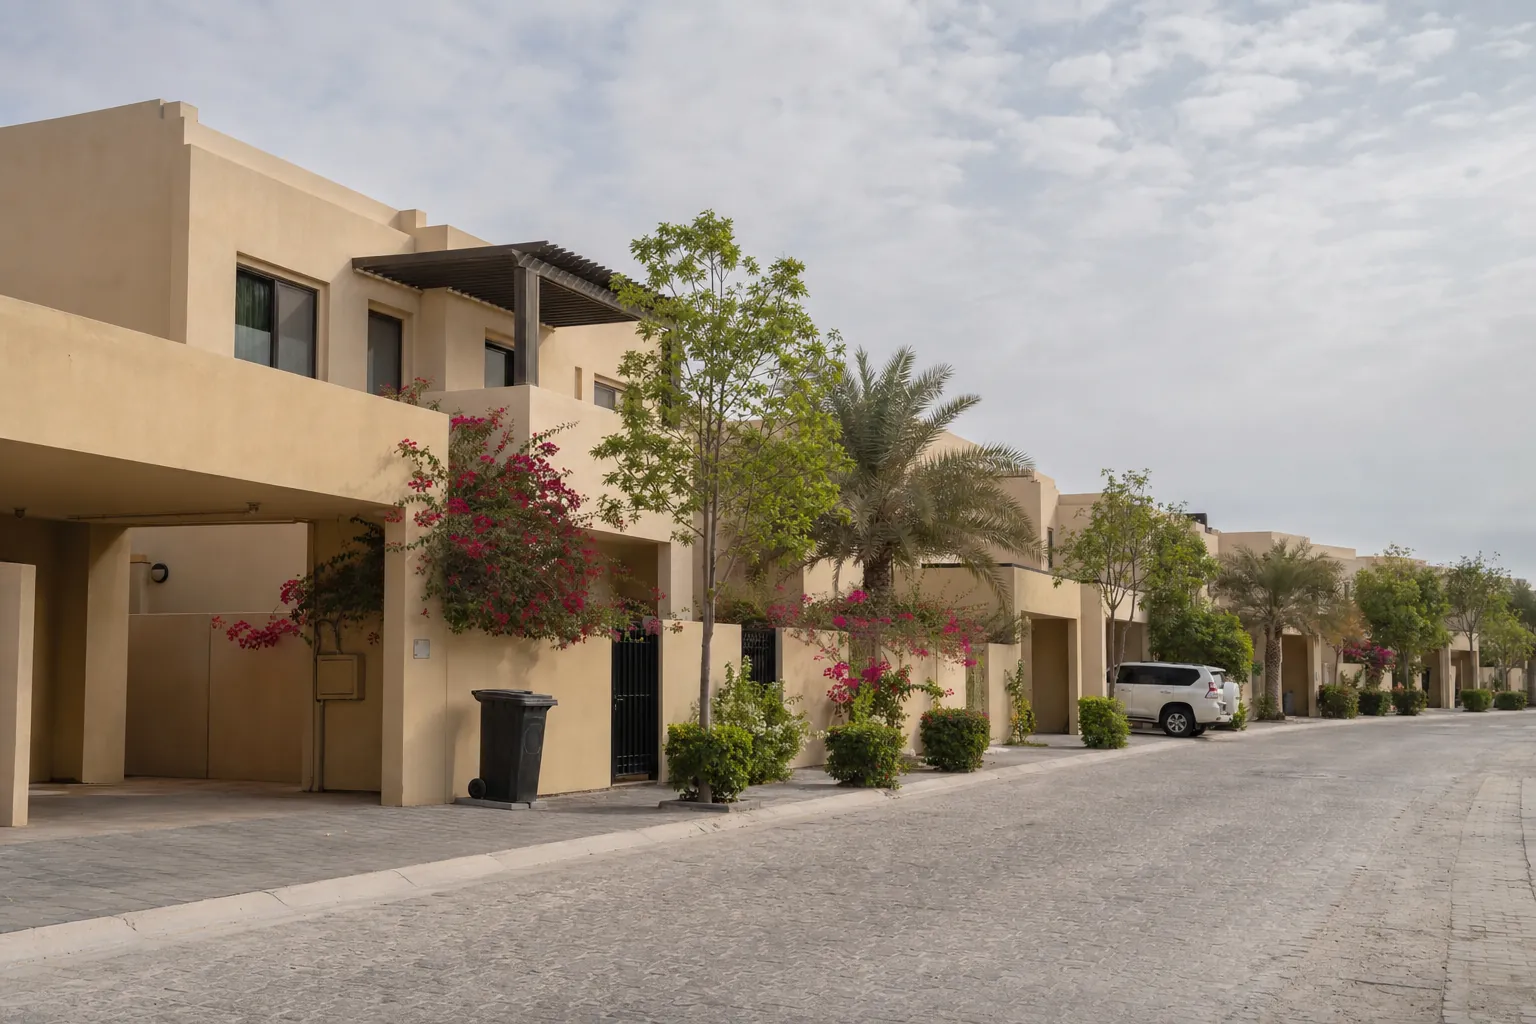
Villa and townhouse prices ran from AED 852 per square foot in DAMAC Hills 2 to AED 8,792 in the Palm Jumeirah Fronds garden homes. Family communities most buyers shortlist sit between AED 1,500 and AED 2,600: Dubai Hills Estate at AED 2,512 with a median of AED 6,634,192, Arabian Ranches at AED 2,188, DAMAC Hills at AED 1,786 and Mudon at AED 1,560.
| Community | AED/sq ft | Median price (AED) | Avg annual rent (AED) | Gross yield |
|---|---|---|---|---|
| Palm Jumeirah Fronds - Garden Homes | 8,792 | 50,361,034 | 1,421,518 | 2.8% |
| Jumeirah Bay Island | 5,882 | 38,768,262 | 2,206,865 | 5.7% |
| Emirates Hills | 4,818 | 81,332,658 | 2,582,793 | 3.2% |
| Jumeirah Islands | 4,678 | 24,521,028 | 734,771 | 3.0% |
| The Meadows | 3,246 | 13,251,377 | 419,528 | 3.2% |
| The Lakes | 2,577 | 8,885,496 | 360,316 | 4.1% |
| Dubai Hills Estate | 2,512 | 6,634,192 | 287,869 | 4.3% |
| Sobha Hartland | 2,410 | 10,953,450 | 542,764 | 4.9% |
| The Springs | 2,231 | 4,799,591 | 197,182 | 4.1% |
| Arabian Ranches | 2,188 | 6,066,409 | 241,722 | 4.0% |
| Jumeirah Village Triangle Villas | 2,164 | 5,971,166 | 196,799 | 3.3% |
| Victory Heights | 2,096 | 8,403,185 | 317,393 | 3.8% |
| Jumeirah Park | 2,050 | 8,827,675 | 334,061 | 3.8% |
| Al Barari | 2,010 | 24,152,193 | 1,511,847 | 6.3% |
| Tilal Al Ghaf | 2,004 | 10,004,817 | 485,073 | 4.8% |
| Dubai Science Park (DuBiotech) | 1,818 | 7,105,389 | 330,311 | 4.7% |
| Arabian Ranches 2 | 1,812 | 6,139,174 | 294,267 | 4.8% |
| DAMAC Hills | 1,786 | 6,979,520 | 358,963 | 5.2% |
| The Villa | 1,716 | 9,078,145 | 349,497 | 3.8% |
| Meydan | 1,691 | 11,879,942 | 615,771 | 5.2% |
| Motor City | 1,690 | 7,583,224 | 338,693 | 4.5% |
| Serena | 1,586 | 3,237,026 | 147,299 | 4.5% |
| Al Furjan | 1,583 | 5,276,406 | 265,807 | 5.1% |
| Arabian Ranches 3 | 1,562 | 5,429,790 | 263,585 | 4.9% |
| Mudon | 1,560 | 5,636,937 | 301,769 | 5.4% |
| Living Legends | 1,522 | 5,884,076 | 237,040 | 4.0% |
| Wasl Gate | 1,441 | 4,037,122 | 231,641 | 5.8% |
| Reem Townhouses | 1,394 | 3,518,254 | 167,846 | 4.8% |
| The Valley | 1,362 | 7,144,682 | 349,817 | 4.9% |
| Dubai South Residential District | 1,357 | 4,520,433 | 199,294 | 4.4% |
| Town Square Townhouses | 1,350 | 2,808,424 | 140,378 | 5.0% |
| Rukan | 1,318 | 1,443,571 | 101,923 | 7.1% |
| Dubai Silicon Oasis | 1,314 | 5,354,550 | 224,125 | 4.2% |
| The Sustainable City | 1,273 | 4,906,450 | 278,143 | 5.7% |
| Dubai South Townhouses | 1,224 | 3,090,209 | 142,177 | 4.6% |
| Falcon City of Wonders | 1,194 | 5,490,560 | 239,568 | 4.4% |
| DAMAC Lagoons | 1,166 | 3,587,631 | 208,645 | 5.8% |
| Jumeirah Village Circle Villas | 1,156 | 4,149,235 | 227,228 | 5.4% |
| Nad Al Sheba | 1,085 | 4,763,150 | 218,754 | 4.6% |
| DAMAC Hills 2 | 852 | 1,727,004 | 101,400 | 5.9% |
Which Dubai areas have the highest rental yields?
The highest gross apartment yield in September 2026 was 9.8% in Dubai Investments Park, followed by 8.9% in International City. The pattern is consistent: the lower the price per square foot, the higher the gross yield. Prime waterfront and Downtown apartments returned between 5% and 6% gross.
| Community | Gross yield | AED/sq ft | Avg annual rent (AED) |
|---|---|---|---|
| Dubai Investments Park | 9.8% | 701 | 125,890 |
| International City | 8.9% | 658 | 37,373 |
| Dubai Production City | 8.6% | 986 | 58,694 |
| DAMAC Hills 2 | 8.5% | 1,011 | 173,556 |
| Rukan | 8.4% | 1,117 | 61,116 |
| Dubai Sports City | 8.1% | 957 | 67,910 |
| Remraam | 8.0% | 937 | 79,310 |
| Al Khail Heights | 7.8% | 975 | 75,121 |
| Dubai Residence Complex | 7.8% | 832 | 52,124 |
| Discovery Gardens | 7.8% | 935 | 50,605 |
Villas and townhouses yield less than apartments. Rukan led at 7.1%, followed by Al Barari at 6.3% and DAMAC Hills 2 at 5.9%.
| Community | Gross yield | AED/sq ft | Avg annual rent (AED) |
|---|---|---|---|
| Rukan | 7.1% | 1,318 | 101,923 |
| Al Barari | 6.3% | 2,010 | 1,511,847 |
| DAMAC Hills 2 | 5.9% | 852 | 101,400 |
| DAMAC Lagoons | 5.8% | 1,166 | 208,645 |
| Wasl Gate | 5.8% | 1,441 | 231,641 |
| Jumeirah Bay Island | 5.7% | 5,882 | 2,206,865 |
| The Sustainable City | 5.7% | 1,273 | 278,143 |
| Jumeirah Village Circle Villas | 5.4% | 1,156 | 227,228 |
Which Dubai communities sold the most homes in September 2026?
Jumeirah Village Circle was the busiest apartment community with 761 sales, 419 off-plan and 342 ready,. Dubai South followed with 746, almost all off-plan, after leading the city in August. Business Bay was the second-largest ready market with 204 resales.
| Community | Off-plan sales | Ready sales | Total |
|---|---|---|---|
| Jumeirah Village Circle | 419 | 342 | 761 |
| Dubai South | 706 | 40 | 746 |
| Majan | 490 | 38 | 528 |
| Downtown Jebel Ali | 406 | 11 | 417 |
| Dubai Creek Harbour | 304 | 85 | 389 |
| Motor City | 311 | 27 | 338 |
| Dubai Residence Complex | 251 | 68 | 319 |
| Business Bay | 114 | 204 | 318 |
| City of Arabia | 225 | 3 | 228 |
| Arjan | 137 | 81 | 218 |
| DAMAC Lagoons | 216 | 0 | 216 |
| Dubai Investments Park | 203 | 11 | 214 |
| Dubai Production City | 152 | 57 | 209 |
| Sobha Central | 174 | 0 | 174 |
| Dubai Sports City | 72 | 89 | 161 |
For villas and townhouses, off-plan demand concentrated in Dubai Investments Park (126 sales), Sobha Sanctuary (113) and Greenz by Danube (62). In the ready market DAMAC Lagoons led with 105 sales, ahead of DAMAC Hills 2 (67) and Mudon (54).
Which Dubai areas moved most in price during September?
| Community | Type | Change |
|---|---|---|
| Jumeirah Village Triangle | Villas | +6.27% |
| Palm Jumeirah Fronds - Garden Homes | Villas | +4.40% |
| Jumeirah Islands | Villas | +4.30% |
| Jumeirah Village Circle | Villas | +3.41% |
| Living Legends | Apartments | +2.89% |
| Al Barsha | Apartments | +2.27% |
| Nad Al Sheba | Villas | +2.17% |
| Dubai Water Canal | Apartments | +1.80% |
| Al Jaddaf | Apartments | -10.95% |
| Dubai Maritime City | Apartments | -7.97% |
| Motor City | Villas | -7.47% |
| Barsha Heights | Apartments | -7.00% |
| Al Barari | Villas | -6.04% |
| The Lakes | Villas | -5.72% |
| Wasl Gate | Apartments | -5.29% |
| Zabeel | Apartments | -4.91% |
Read these with care. A median moves with the units that happened to sell, so Al Jaddaf's 10.95% fall reflects a month in which 101 of its 102 apartment sales were off-plan units, priced differently from its finished stock. Price per square foot across several months is the better guide to a single community.
How to read these figures
Title Deed and Oqood. The Dubai Land Department records a completed property transfer with a title deed and an off-plan sale with an Oqood registration. Title deed counts are the ready and resale market, Oqood counts the off-plan market, and together they make total residential sales.
The price index. The Dubai City Index is Property Monitor's emirate-wide median sale price per square foot, published monthly from January 2008. Community figures come from the same source but are medians of each community's own sales.
Yields are gross. Rent per square foot over price per square foot, before service charges, transfer and agency fees, empty months and finance costs. Net yields usually run 1.5 to 2.5 points lower.
Data and revisions. Figures were read from Property Monitor on 5 October 2026. Late registrations can lift a month slightly; August's total of 11,157 was unchanged when re-read four weeks later. Property Monitor's own residential headline for September is 3,181 title deed and 7,188 Oqood sales; the 10,373 used here adds its apartment and villa series, a difference of four transactions. Two communities are left out of the price tables: Jaddaf Waterfront, which had no recorded median sale price this month, and one entry Property Monitor lists under a truncated name.
Dubai property market, September 2026: common questions
How many properties were sold in Dubai in September 2026?
Dubai recorded 10,373 residential sales in September 2026, worth AED 23.63 billion, according to Property Monitor. 7,188 were off-plan and 3,185 were ready or resale homes.
Is the Dubai property market crashing?
Prices show a mild dip. Property Monitor's Dubai-wide median price was AED 1,632 per square foot in August 2026, 3.0% below its October 2025 peak. Sales volumes have eased from the 2024 and 2025 boom and in Q3 2026 were slightly above Q3 2023.
What is the average price per square foot in Dubai?
The Dubai City Index stood at AED 1,632 per square foot in August 2026. By community, apartments ranged from AED 658 in International City to AED 9,415 on Jumeirah Bay Island in September 2026.
What was the previous peak for Dubai property prices?
Before the current cycle, the index peaked at AED 1,234 per square foot in September 2014 and AED 1,211 in September 2008. The current level is about a third higher than both.
How much does an apartment cost in Jumeirah Village Circle?
The median apartment price in Jumeirah Village Circle was AED 1,192,671 in September 2026, or AED 1,259 per square foot, with an average annual rent of AED 86,177.
Which Dubai area has the highest rental yield?
Dubai Investments Park apartments returned the highest gross yield in September 2026 at 9.8%, followed by International City at 8.9%.
How many properties were sold in Dubai in Q3 2026?
Dubai recorded 34,646 residential sales worth AED 73.88 billion between July and September 2026, with off-plan making up 71.0%.
Source
All figures in this report are from Property Monitor, September 2026 Dubai Real Estate Market Statistics and Dubai City Index, read on 5 October 2026. Transaction registrations originate with the Dubai Land Department. Community names follow Property Monitor's classification.
The August 2026 edition of this report holds the previous month's tables. Our Dubai real estate statistics page carries the standing market dashboard, and the RERA rental index guide explains how far a landlord may raise rent.
AKT Real Estate is a Dubai brokerage licensed by RERA under ORN 15673, at Office 604, Building 12, Bay Square, Business Bay. If you want these figures applied to a particular budget, community or handover date, talk to us about buying property in Dubai or call +971 50 518 4986.
This report is general market information. Figures are historical and do not forecast returns; take professional advice before any purchase.